Construction progress reporting

Every site. Every period. One clear record.

Drone, 360, weather and issues, published period by period in one link Owners actually open.

progressportals.io/p/your-project
The Olympic Plaza Redevelopment portal: a drone banner of downtown Calgary and its five reporting periods.
01The problem

Progress reporting shouldn't need a site visit.

Owners want to know where the job stands. Your team wants to stop answering the same question by email.

Updates live in five places.

Photos in a drive, drawings in email, the schedule in a PDF. Nobody sees the same picture.

Delays turn into arguments.

Without a record of the weather and site conditions, a lost week is your word against theirs.

Issues slip between reports.

A comment on a photo gets lost in a reply-all. Three weeks later it is a change order.

02The solution

One link per period, built from the widgets you choose.

Each period is a single page. Turn on the widgets this job needs, put them in order, and publish. Owners and stakeholders see one clean record instead of five places to look.

Widgets for this period

Pick only what matters

A drone-heavy month gets maps and 360s. A quiet week might be a summary and photos.

Put them in order

Drag widgets into place in each period, so the most important part comes first.

Publish when it is ready

Keep a period as a draft until it is reviewed, then share one link.

Olympic Plaza RedevelopmentPeriod 5
Progress summary
Photo gallery
360 walkthroughs
Before and after
Weather
Documents and links

What stakeholders see. Only the widgets you turned on, in your order.

03Before and after

Drag to see the change.

The same drone view of Olympic Plaza, two periods apart, aligned automatically. Add a before and after to any period.

Olympic Plaza, earlier period. Olympic Plaza, later period. Before After
04Features

See the site from anywhere.

Give each period its own drone maps, 360 walkthroughs and photo sets, in the same layout every time so change jumps out.

  • Orthomosaics and drawings layered on a live site map
  • 360 walkthroughs you build in the browser, with pinned notes
  • Before and after sliders across any two periods
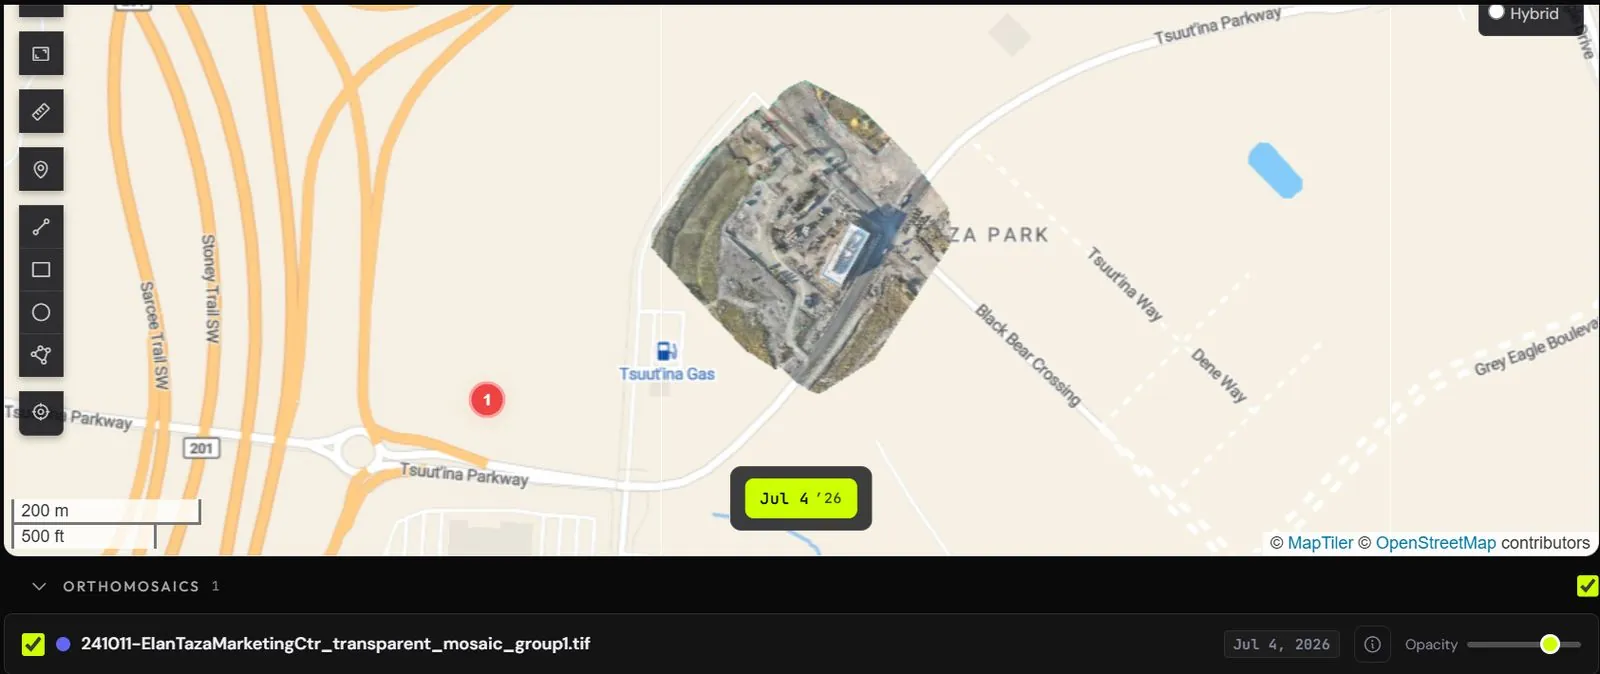
Site map with a drone orthomosaic layered over the street map.

Prove the conditions.

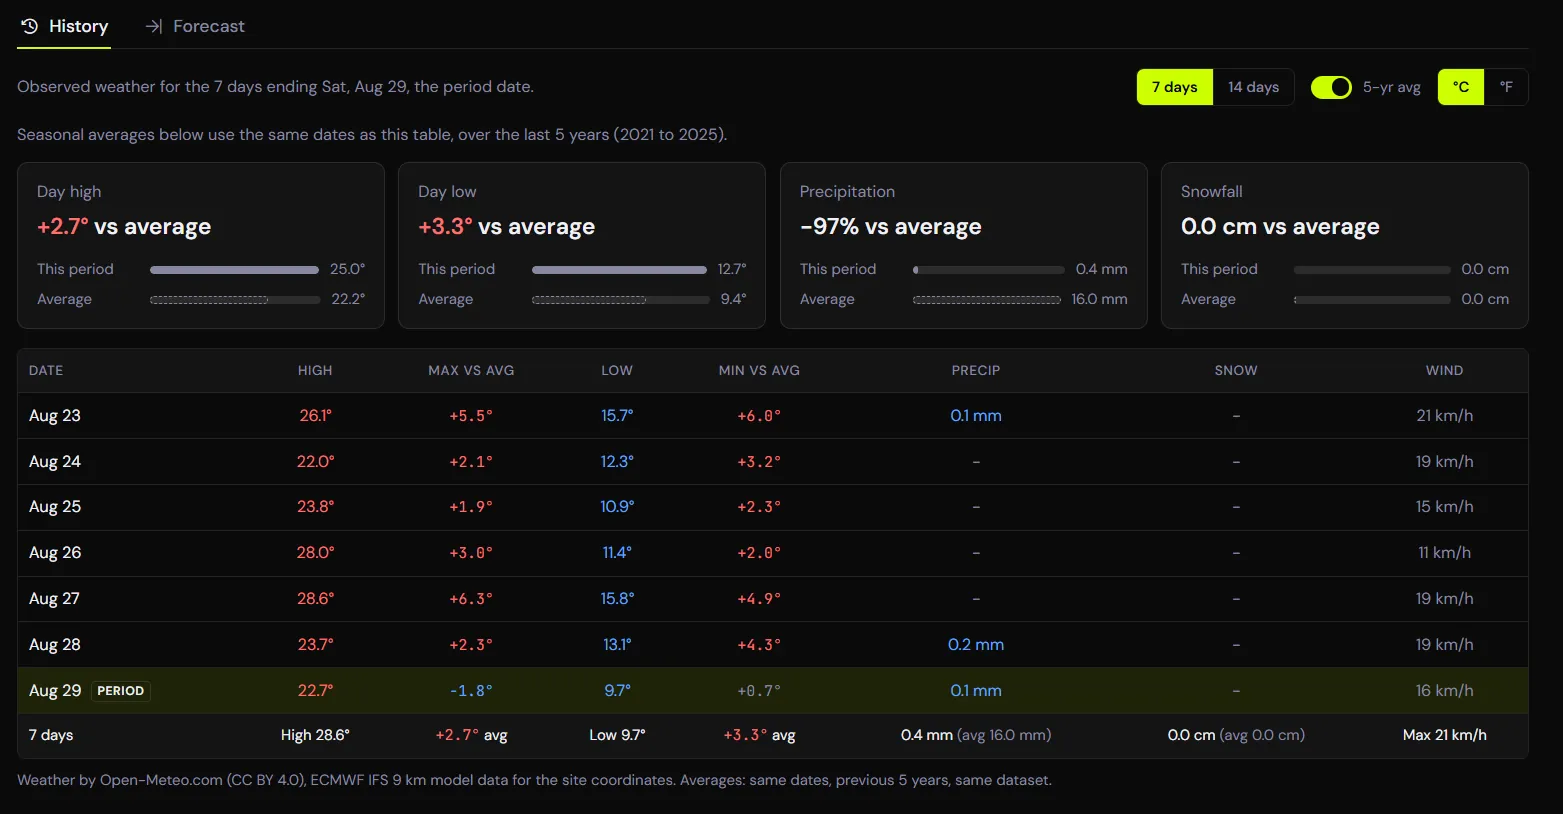
Add a weather record to any period: what happened on site, how it compares to the last five years, and what the forecast said that day.

  • Day highs, lows, rain and snow against the seasonal average
  • The forecast as it stood on the period date, frozen
  • Tides and currents for marine and waterfront work
Olympic Plaza weather for the week ending August 29: highs 2.7 degrees above the 5-year average and almost no rain.

Track every issue to the end.

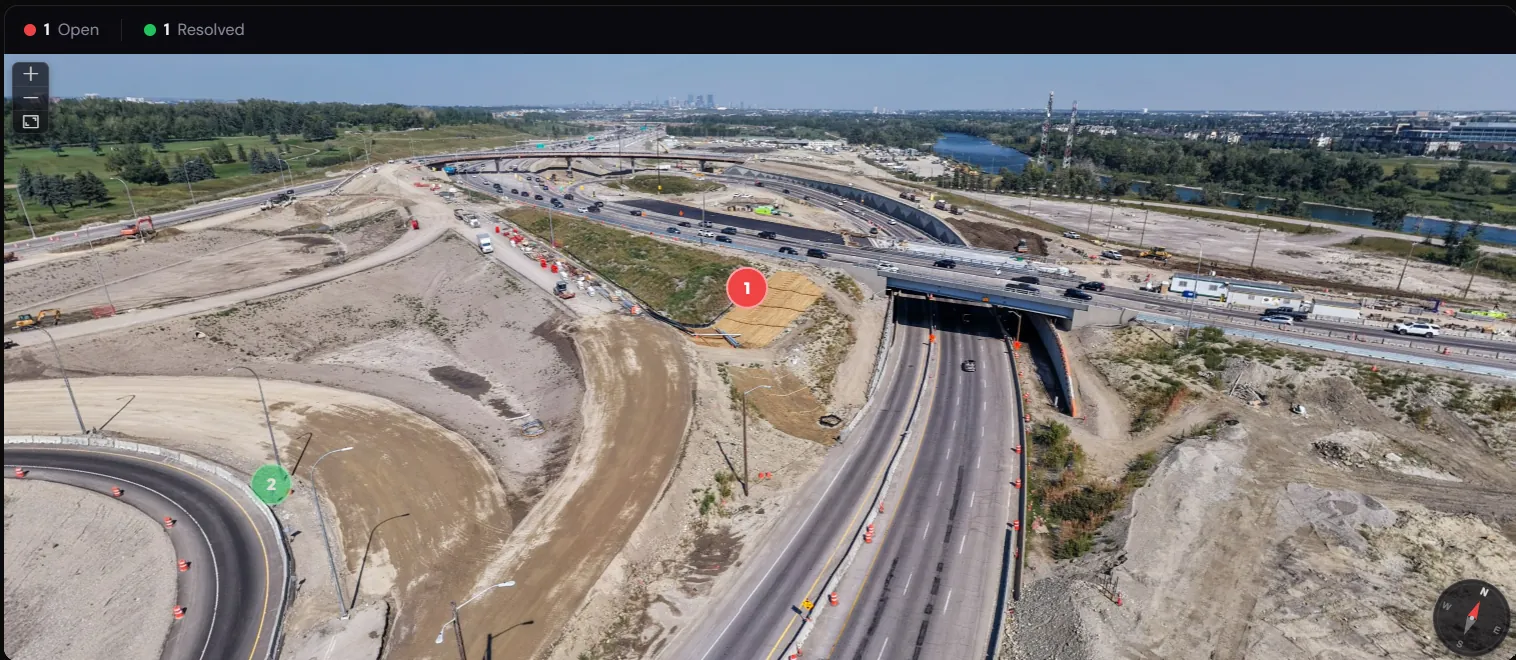
Pin a note right where the problem is, on a photo or inside a 360. Owners reply in the portal, and nothing gets resolved without a record.

  • Open and resolved counts on every project and period
  • Threads with replies, resolve and reopen
  • A full audit trail of who changed what, and when
A drone 360 of the Deerfoot Trail South interchange with two pinned issues, one open and one resolved.

Report and share in one link.

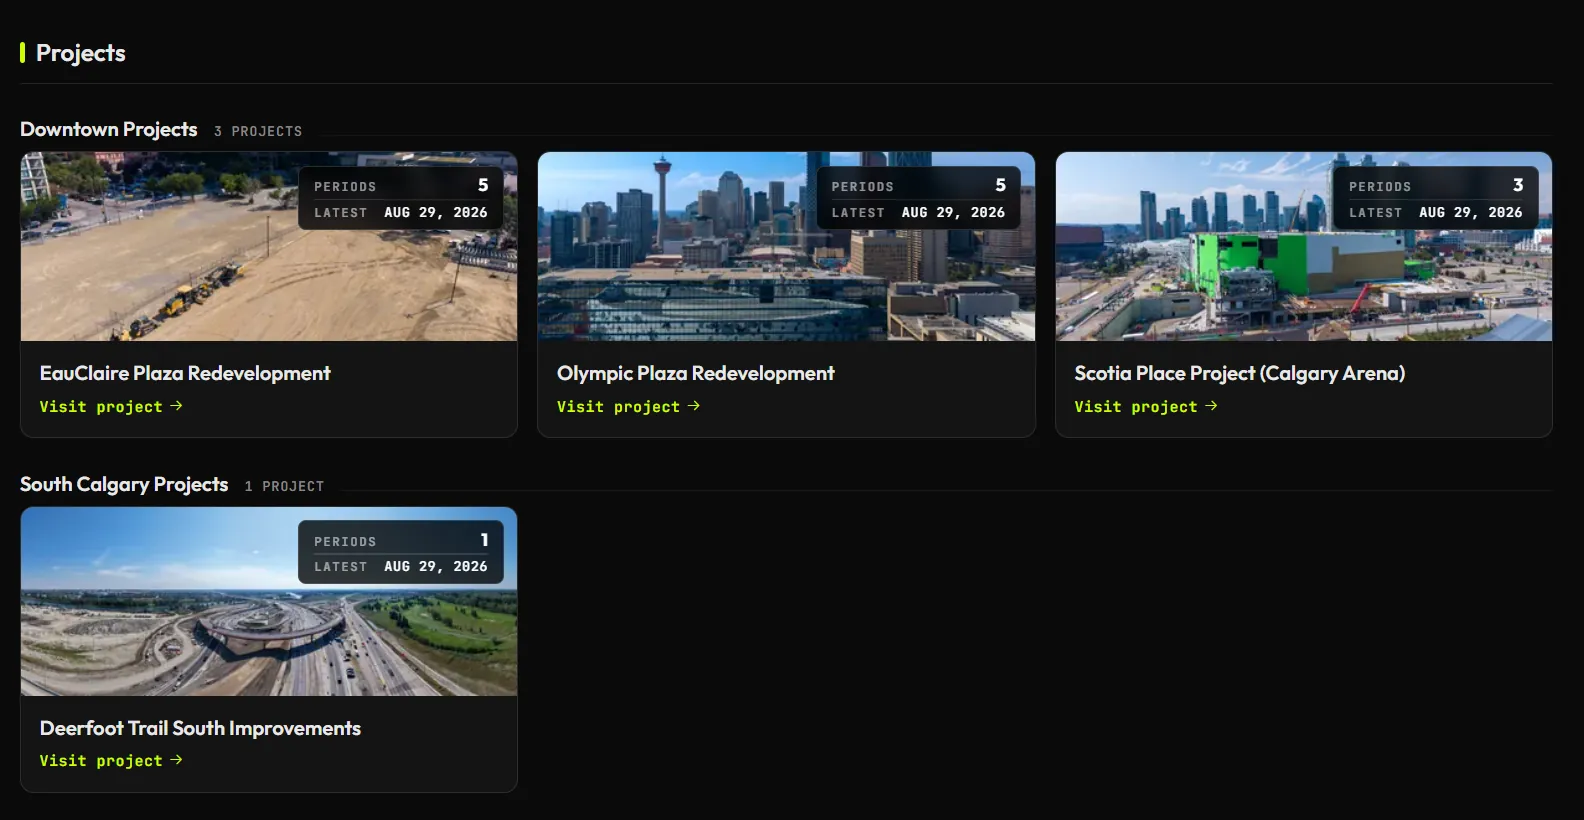
Publish a period and everyone sees the same thing: the summary and the sections you chose, in order. Group projects into a Program hub when there is more than one.

  • A Program hub that ties every project together
  • Automated PDF reports, built from the period, for the people who still want paper
  • Public, private or team-only, per project and per period
The Calgary Construction Projects Program hub: Eau Claire, Olympic Plaza, Scotia Place and Deerfoot Trail South, each with its latest period.
●From the drone to the portal

Fly it today. Owners see it tomorrow.

Upload drone flights, 360s and site photos and publish them in the next period, so the record keeps pace with the job.

05And more

Everything else a period can hold.

Tides, currents and moon

Official Canadian Hydrographic Service predictions next to the weather, for marine and waterfront sites.

SatSunMonTueWedThuFri1.03.05.00mkn
Height, mFlood, inboundEbb, outbound

Video and VR tours

YouTube, Vimeo, Kuula and Matterport, right in the period.

Documents and links

Schedules, specs and drawings, attached where people will look.

Automated reporting

A polished PDF of any period in one click, built from its summary, photos, weather and issues.

You decide who sees what

Public links, private sign-in, or team-only, per project and per period.

Your layout, every period

Turn sections on or off, drag them into order, and set it once for the whole project.

06For Owners

Running more than one site? Start with the week ahead.

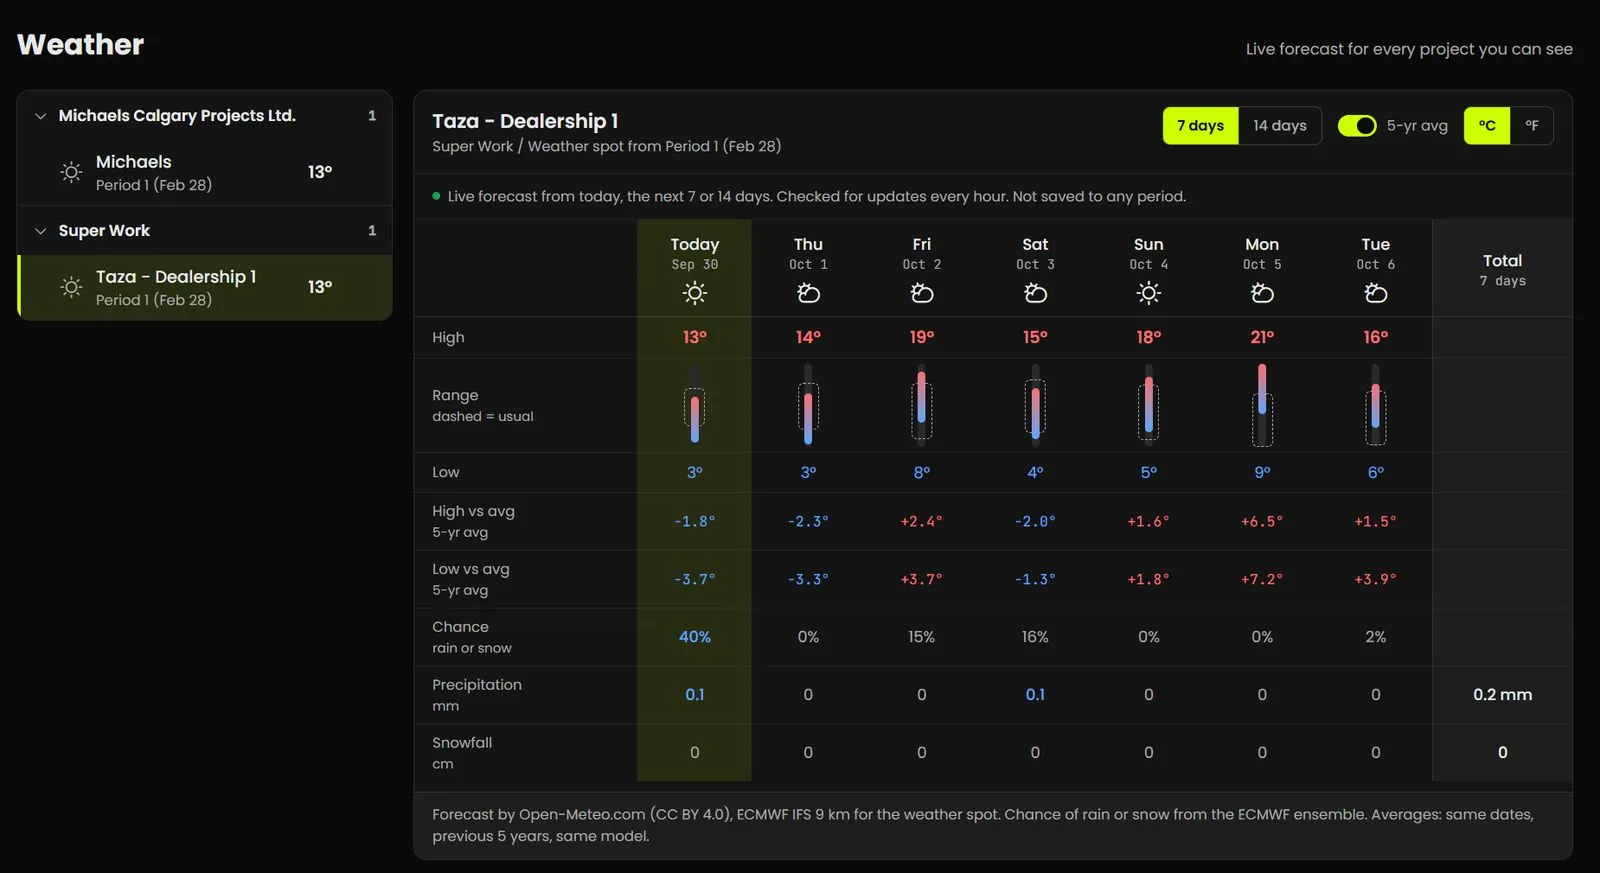
Group projects into Programs and see the live 14-day forecast for every site with weather on one page, so the crew planning call starts with facts.

Programs

One hub for a portfolio, with each project's latest period, open issues and team.

Live weather for your sites

Today plus 7 or 14 days, chance of rain or snow, and how it compares to normal.

Set up once

Push the same weather location and window to every period in a project in one step.

The Weather page: sites grouped by Program and a 7-day live forecast.
07How it works

Up and running before the next site meeting.

1

Capture

Your team uploads photos, drone maps and 360s.

2

Publish the period

Add the summary and the sections you need, including weather, forecast and more, through different widgets.

3

Share the link

Stakeholders open it on any device. No app needed, and sign-in is only required if you choose to require it.

Need it captured?

Plus15 Media can fly your site and shoot the drone maps, 360s and photos for each period.

Visit Plus15 Media(opens in a new tab)

Built for the people who sign off.

  • Hosted in North America
  • Encrypted in transit and at rest
  • Signed, expiring file links
  • Google sign-in
  • Enforced MFA for admins
  • Role-based access
  • Full audit log
  • Cloudflare protected
08Questions

Questions Owners ask us.

Do my stakeholders need an account?

No. Share a public link and they can view on any phone or laptop. Turn on private access when a project needs it, and invite people by email.

Where does the weather come from?

From the ECMWF forecast model, calculated for your site's own coordinates. When you add weather to a period, it stores the observed weather, a 5-year average for the same dates, and the forecast as it stood on the period date.

Can we bring our own drone data?

Yes. Upload orthomosaics, KMZ files, drawings, photos and 360s from the tools you already use.

Who captures the content?

Your team, or ours. Plus15 Media can fly the site and handle capture as a service, so your team only publishes.

How secure are shared links?

Files are served through signed, expiring links, and private portals require sign-in. Admins use enforced multi-factor sign-in, and every change is logged.

360
degree walkthroughs, built in the browser
14
day forecast for each site you track
5
years of seasonal averages in the weather widget
3
languages for every viewer

Give Owners a record they can trust.

See a live portal from a real project in a 20-minute demo, or start a trial and publish your first period today.